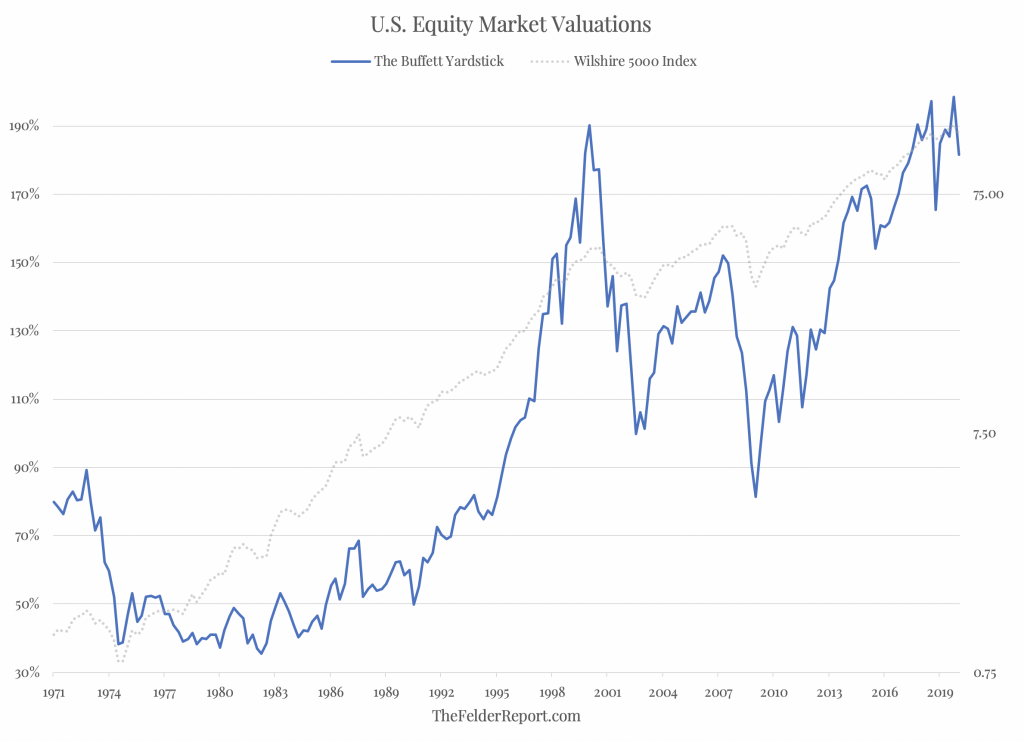
“Risk happens fast,” as they say and it has never happened faster than it did last week. It took just six days for the S&P 500 to fall 10% from a record high, the fastest “correction” in history. Some are even calling it a “crash” and comparing it to the one we saw just over a decade ago. But it’s important to put the recent action into some sort of context. For long-term investors, it’s probably most important to understand that the decline we saw last week has in no way made the broad stock market look cheap, as some might suggest.
To explain what I call “The Buffett Yardstick” in the chart above, I’ll refer you to what the man himself wrote in 2001, “The chart shows the market value of all publicly traded securities as a percentage of the country’s business–that is, as a percentage of GNP. The ratio has certain limitations in telling you what you need to know. Still, it is probably the best single measure of where valuations stand at any given moment.”
And according to this measure stocks are still just as expensive as they were in 2000 at the peak of the dotcom mania prior to a 50% decline in the major indexes and they are 20% more expensive than they were in 2007 prior to a 57% decline. So it’s hard to argue there is much value in the broad indexes at all even after the steep correction we saw last week. What’s more, downside risk is still very elevated.


