
Last week I shared an article on twitter in which Nassim Taleb, of “Black Swan” fame, was asked, “What are the biggest risks out there right now?” He replied:
The fact that the world, as a result of quantitative easing, has seen an asset inflation that benefited the uber-rich, and that nothing has been cured. One cannot cure debt with debt, by transferring from private to public sectors. The markets will ultimately crash again, although this time it will hurt a lot more people.
Taleb suggests investors ought to be “tail hedging” their portfolios as a result. So ‘what is tail hedging?’ you might ask. The “tail” part of it simply refers to the ends of a normal, bell-shaped distribution curve. These represent events in the market that very rarely occur. In this case, it refers to a stock market crash.
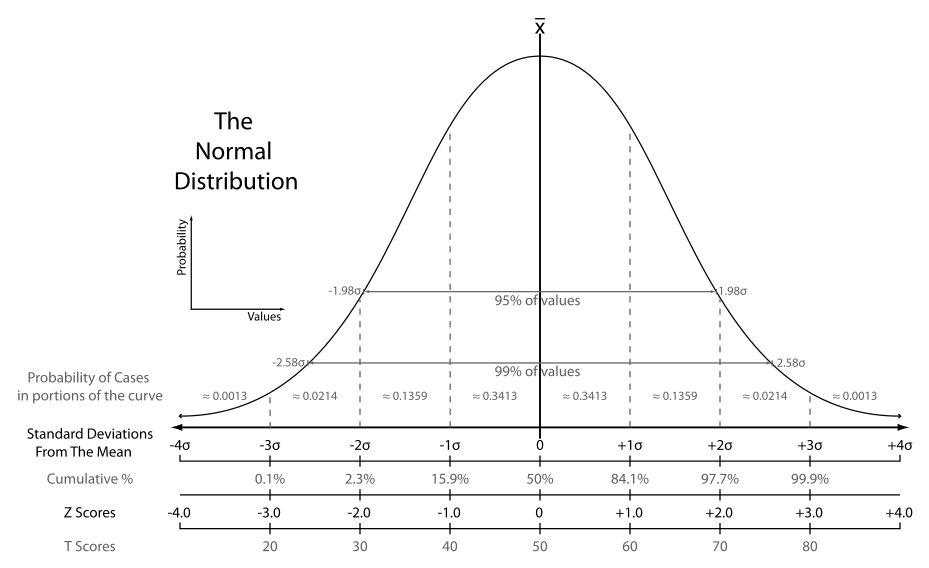 One of the findings Taleb is most famous for is that crashes occur much more frequently than a normal distribution curve would accurately represent. In other words, markets usually have “fat tails.”
 “Hedging” simply means protecting your portfolio from just this sort of “fat tail” event. Taleb is an advisor to a hedge fund which specializes in “tail hedging.” The fund is run by Mark Spitznagel who wrote a book a few years ago called “The Dao of Capital” in which he argues there are times when stocks present very poor potential returns along with very high risk. His preferred gauge for this is Tobin’s Q (see: Why ‘Tobin’s Q’ Should Make You More Cautious Towards The Stock Market Today).
When Tobin’s Q is in its uppermost quartile, as it is today, it suggests this reward/risk equation is not at all favorable for investors. In other words, these “fat tails” get even fatter during these periods thus investors should look to hedge their portfolios against large declines. And this is precisely the “asset inflation” Taleb was referring to in the interview mentioned at the top of this post.
 So how do we go about implementing an effective “tail hedging” strategy? In his book, Spitznagel created a very simple strategy to backtest for the purpose of demonstrating its utility during these times of high risk.
The portfolio I am testing in this study purchases 2-month 0.5 delta puts on the S&P 500 Composite Index (approximately 30 percent out of the money, in the case of a 40 percent implied volatility) at the start of each strategy period at an assumed 40 percent volatility level…. After every month, the 2-month put options position is rolled (the existing options are sold and new 2-month puts are purchased, which resets the position every month)… Each month the portfolio spends one half of one percent on puts, and the remaining 99.5 percent stays invested in the S&P index.
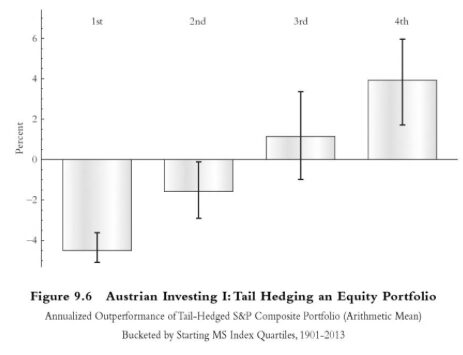
In this example, a tail-hedged portfolio would spend 0.5% of its equity exposure every month buying 2-month put options that are about 30% out-of-the-money. After one month, those put options are sold and new ones bought according to the same methodology. Spitznagel demonstrates the value of this methodology in the chart below. When Tobin’s Q is in its uppermost quartile, the portfolio he describes above outperforms a simple buy-and-hold approach by about 4% per year.
 In putting this into practice today, let’s assume we have $100,000 invested in equities currently so we need to buy $500 in 2-month put options (0.5% of $100,000) that are 30% below the current underlying price. SPY trades at 219.4 as I write this so $154 is about 30% beneath this price. A small segment of the October 21 put options chain is below (from Yahoo!Finance). Looking at the ask prices and volume it looks like the 155 puts are a bit more liquid and better priced than the 154 puts. At $9 each (9c times 100 shares) we can buy 55 of the October 155 put options for $495.
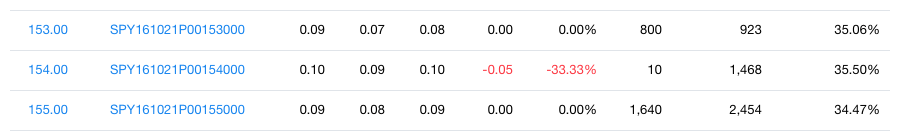
Again, at the end of one month (September 16) these puts would be sold and new puts would be bought using this same process. In an article he wrote for Pensions & Investments magazine last year, Spitznagel describes a similar strategy that helps to explain the mechanics of the strategy described above.
Our tail-hedged portfolio consists of S&P 500 and out-of-the-money put options (specifically one delta which has a strike roughly 30% to 35% below spot) on the S&P 500. At the beginning of every calendar month, using actual option prices, the number of third-month options (with a maturity from 11 to 12 weeks, and also carrying over the payoff from unexpired options) is determined such that the tail-hedged portfolio breaks even for a down 20% move in the S&P 500 over a month. From practice, for scaling the payoff, we can safely assume the S&P 500 options’ implied volatility, or IVol, surface would look similar to the one observed after the lows of the October 2002 crash.
The important part of this paragraph is this: “The number of… options… is determined such that the tail-hedged portfolio breaks even for a down 20% move in the S&P 500 over a month…. We can safely assume the S&P 500 options’ implied volatility, or IVol, surface would look similar to the one observed after the lows of the October 2002 crash.”
Using a simple options calculator (like that available at options-price.com) we can calculate how our put options purchased in the example above would perform after a 20% decline in the span of just a month. In this hypothetical example, SPY drops to 175 and implied volatility rises to 55 (for this example I took the VIX level of 45 in October 2002, as suggested by Spitznagel, and added 10 points for 10% out-of-the-money put options). Our puts have gone from $9 each in value to $328.10. We own 55 of them so they are now worth just over $18,000 in total.
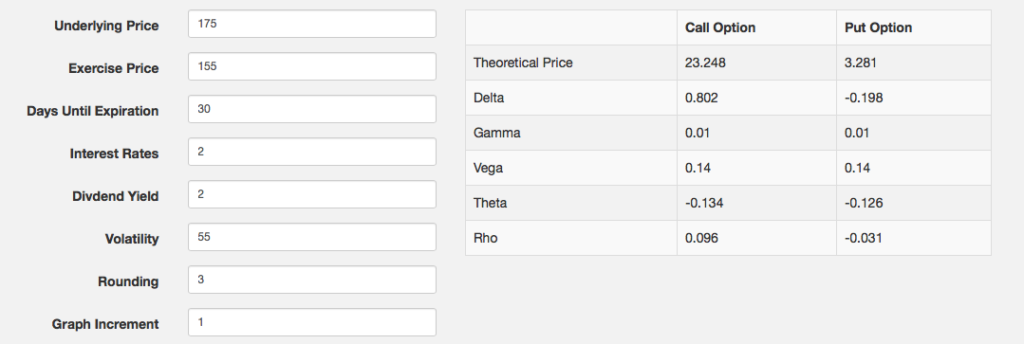
This was an attempt to hedge a 20% decline in $100,000 of equities so it performed pretty well in our hypothetical crash, protecting against nearly the entire loss. And you could also work backwards, as Spitznagel suggests in the second strategy described above, using this calculator. This way, you might say I want to protect against a $20,000 loss so I need to buy 61 put options ($20,000 divided by $328.10) rather than just the 55 we bought using the first strategy.
However, what I like about the first strategy is that the dollar amounts are limited up front (and we don’t have to make any assumptions about future implied volatility). The worst case scenario is you spend 0.5% of your portfolio every month buying worthless put options. The only way they would all be worthless is if the stock market went almost straight up for the entire year. And in that case, the equity portfolio should do far better than the losses spent on this sort of insurance against a crash.
It’s also important to remember that the real value in this strategy is only during times of extreme overvaluation in the stock market. Most of the time “tail hedging” in this way does not add any real benefit and can actually be a major hindrance to overall performance. That said, the stock market currently meets Spitznagel’s uppermost threshold for hedging so, according to both him and Taleb, it’s probably something most investors ought to consider right now.