Yesterday David Einhorn made news by writing, “we are witnessing our second tech bubble in 15 years.” Almost immediately folks started attacking the idea on the grounds that, ‘individual investors haven’t bought into it yet,’ and ‘if everyone is talking about a bubble, it can’t be a bubble.’
I love hearing all the folks here ridicule Einhorn's bubble call. I'm sure he does, too. Actually validation of his idea.
— Jesse Felder (@jessefelder) April 23, 2014
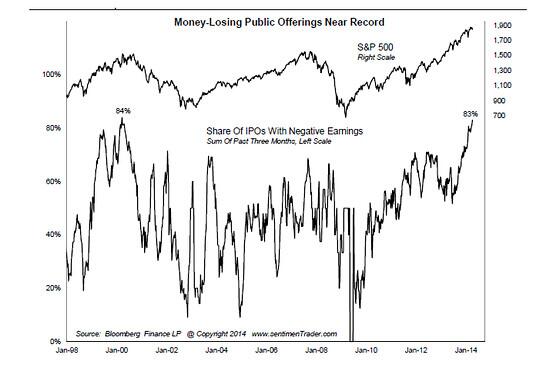
What I find fascinating is none of these folks actually tackle the evidence Einhorn puts forward: obscene valuations, short sellers throwing in the towel and the popularity of money-losing IPOs. They merely throw up these two red herrings.
Ultimately, I think that the argument centers around the definition of the word, “bubble.” Jeremy Grantham defines a bubble as valuations that are two standard deviations above their long-term average. He also looks for anecdotal signs of euphoria and based on these measures he doesn’t currently see a bubble in the broader stock market. This would seemingly validate Einhorn’s critics.
But Einhorn didn’t say there is a bubble in the broader stock market; he said there is a “tech bubble.” And Grantham is also looking at the valuation of market-cap weighted indexes which tell us little or nothing about individual sectors like tech or even the broader market as evidenced by small cap stocks.
What I find even more disturbing this time than the original dotcom bubble is, while it may not show in the market-cap weighted measures, the overvaluation is far more pervasive today. Back in 1999-2000 there were, in fact, great bargains to be had in the “brick and mortar” companies investors shunned in favor of the high flying tech names. I was able to buy stocks like Washington Mutual at 5x earnings and Abercrombie & Fitch at 8x. Both stocks performed very, very well during the tech bust.
Today, almost everything is priced for perfection. This is clearly evidenced by two indicators. First, valuations among individual stocks have rarely been so tightly correlated. Second, the median stock is now more highly valued on a price/revenue basis than at any other time in history. Essentially, this means that almost everything is overpriced and to a degree never before seen. If we can agree that 2000 was a bubble, it’s very hard to deny that stocks, now being even more pervasively overvalued, are not currently experiencing one. And at the very least there is a bubble in small cap stocks.
In terms of the tech sector, we’ve only seen one other time in history where the percentage of money-losing IPOs was as high as it is currently. Can you guess when that was? Can you also tell me how to value a company with no earnings? Again, if we can agree that was a bubble, how is this NOT one?
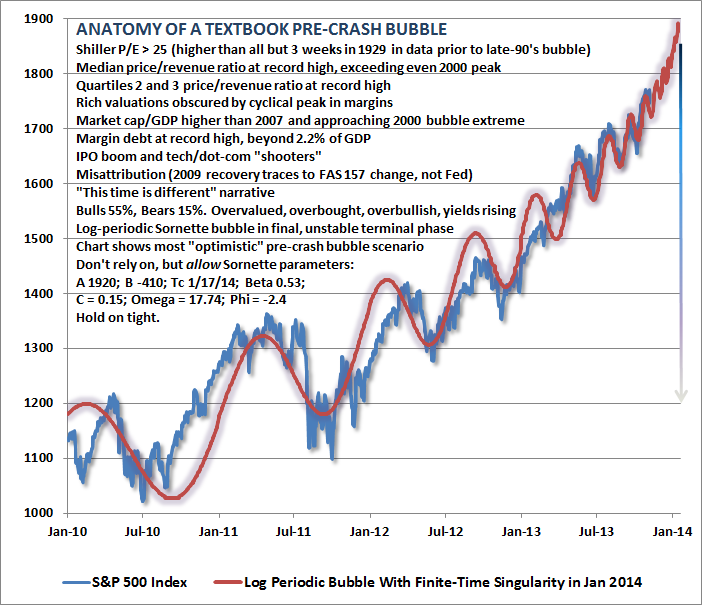
Personally, however, I like to combine as many types of useful analysis as possible, fundamental, technical, sentiment, etc. to reach a holistic conclusion. In contrast to Grantham, Didier Sornette, another bubble expert, defines a “bubble” based on a technical pattern. He looks for what he calls a “log periodic bubble” that is essentially a price pattern that nearly every bubble in every asset class experiences. John Hussman explains:
[blockquote2]A log periodic pattern is essentially one where troughs occur at increasingly frequent and increasingly shallow intervals. As Sornette has demonstrated across numerous bubbles over history in a broad variety of asset classes, adjacent troughs (say T1, T2, T3, etc) are often related to the crash date (the “finite-time singularity” Tc) by a constant ratio: (Tc-T1)/(Tc-T2) = (Tc-T2)/(Tc-T3) and so forth, with the result that successive troughs come closer and closer in time until the final blowoff occurs.[/blockquote2]It’s probably easier to just look at the chart pattern. Here Hussman overlays the “log-periodic” bubble model over the S&P 500 Index over the past few years. Technically, the current stock market pattern fits very closely with Sornette’s bubble model:

Finally, sentiment has rarely been this euphoric. Investors Intelligence reports the highest bull/bear ratio since 1987. Rydex traders have never been so heavily invested in bullish funds relative to bearish ones. And margin debt is setting new records every month, a testament to investors unwavering belief in higher prices. I have yet to see any real evidence that retail investors haven’t yet joined the party. All of these indicators suggest just the opposite.
Fundamentals, technicals and sentiment, then, all agree that stocks are currently experiencing many, many signs of a bubble: record (or near) valuations, bubblish price patterns and euphoric devotion to the asset class. I’m certainly not qualified to be the arbiter when it comes to the official definition of a bubble. Guys like Grantham and Sornette are much smarter than I am. But does it really matter if the broader stock market meets everyone’s individual definition or not when a wide variety of indicators like these across a variety of disciplines are all screaming, “BUBBLE”?
To me, if it looks like duck and sounds like duck I’m not going to call it a dove because I hope stocks are headed higher and I’m afraid of missing out. And I’m also pretty sure that just because other people are calling it a duck doesn’t mean it’s not a duck.
The BS meme about bubbles and corrections is back. No one ever learns pic.twitter.com/eWXBQtE9zm
— Urban Carmel (@ukarlewitz) April 23, 2014
Related: What Does Reduce Risk Mean To You?
