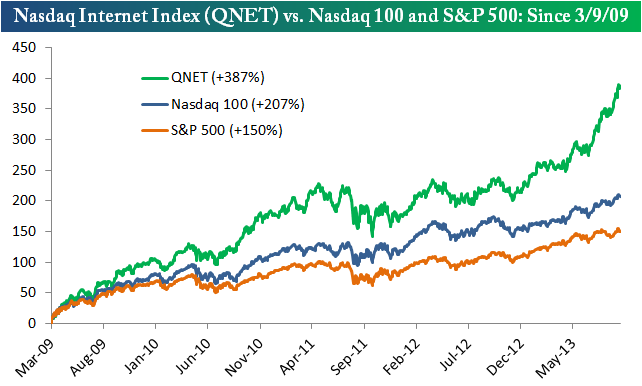
Yesterday I brought to your attention the “wedge” reversal pattern that has now formed in the Nasdaq 100. Today we get the chart below from Bespoke showing just how much the internet sector has outperformed the broader indexes over the past few years. That green line has nearly gone parabolic this year; clearly they’re partying like it’s 1999!
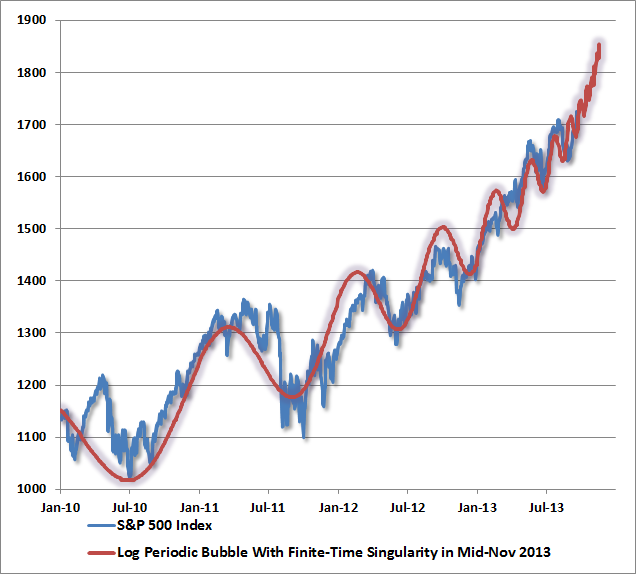
Another relevant chart that drew my attention is this next one that comes from John Hussman. He essentially overlayed Didier Sornette’s bubble model on top of the S&P 500 since 2010 and, what do you know, they match up pretty well!

All this begs the question, is this the internet bubble’s long-awaited “echo bubble“? All I can say is that it would be rather poetic considering the internet-heavy Nasdaq 100 has now retraced a near-perfect Fibonacci 61.8% of the crash.
