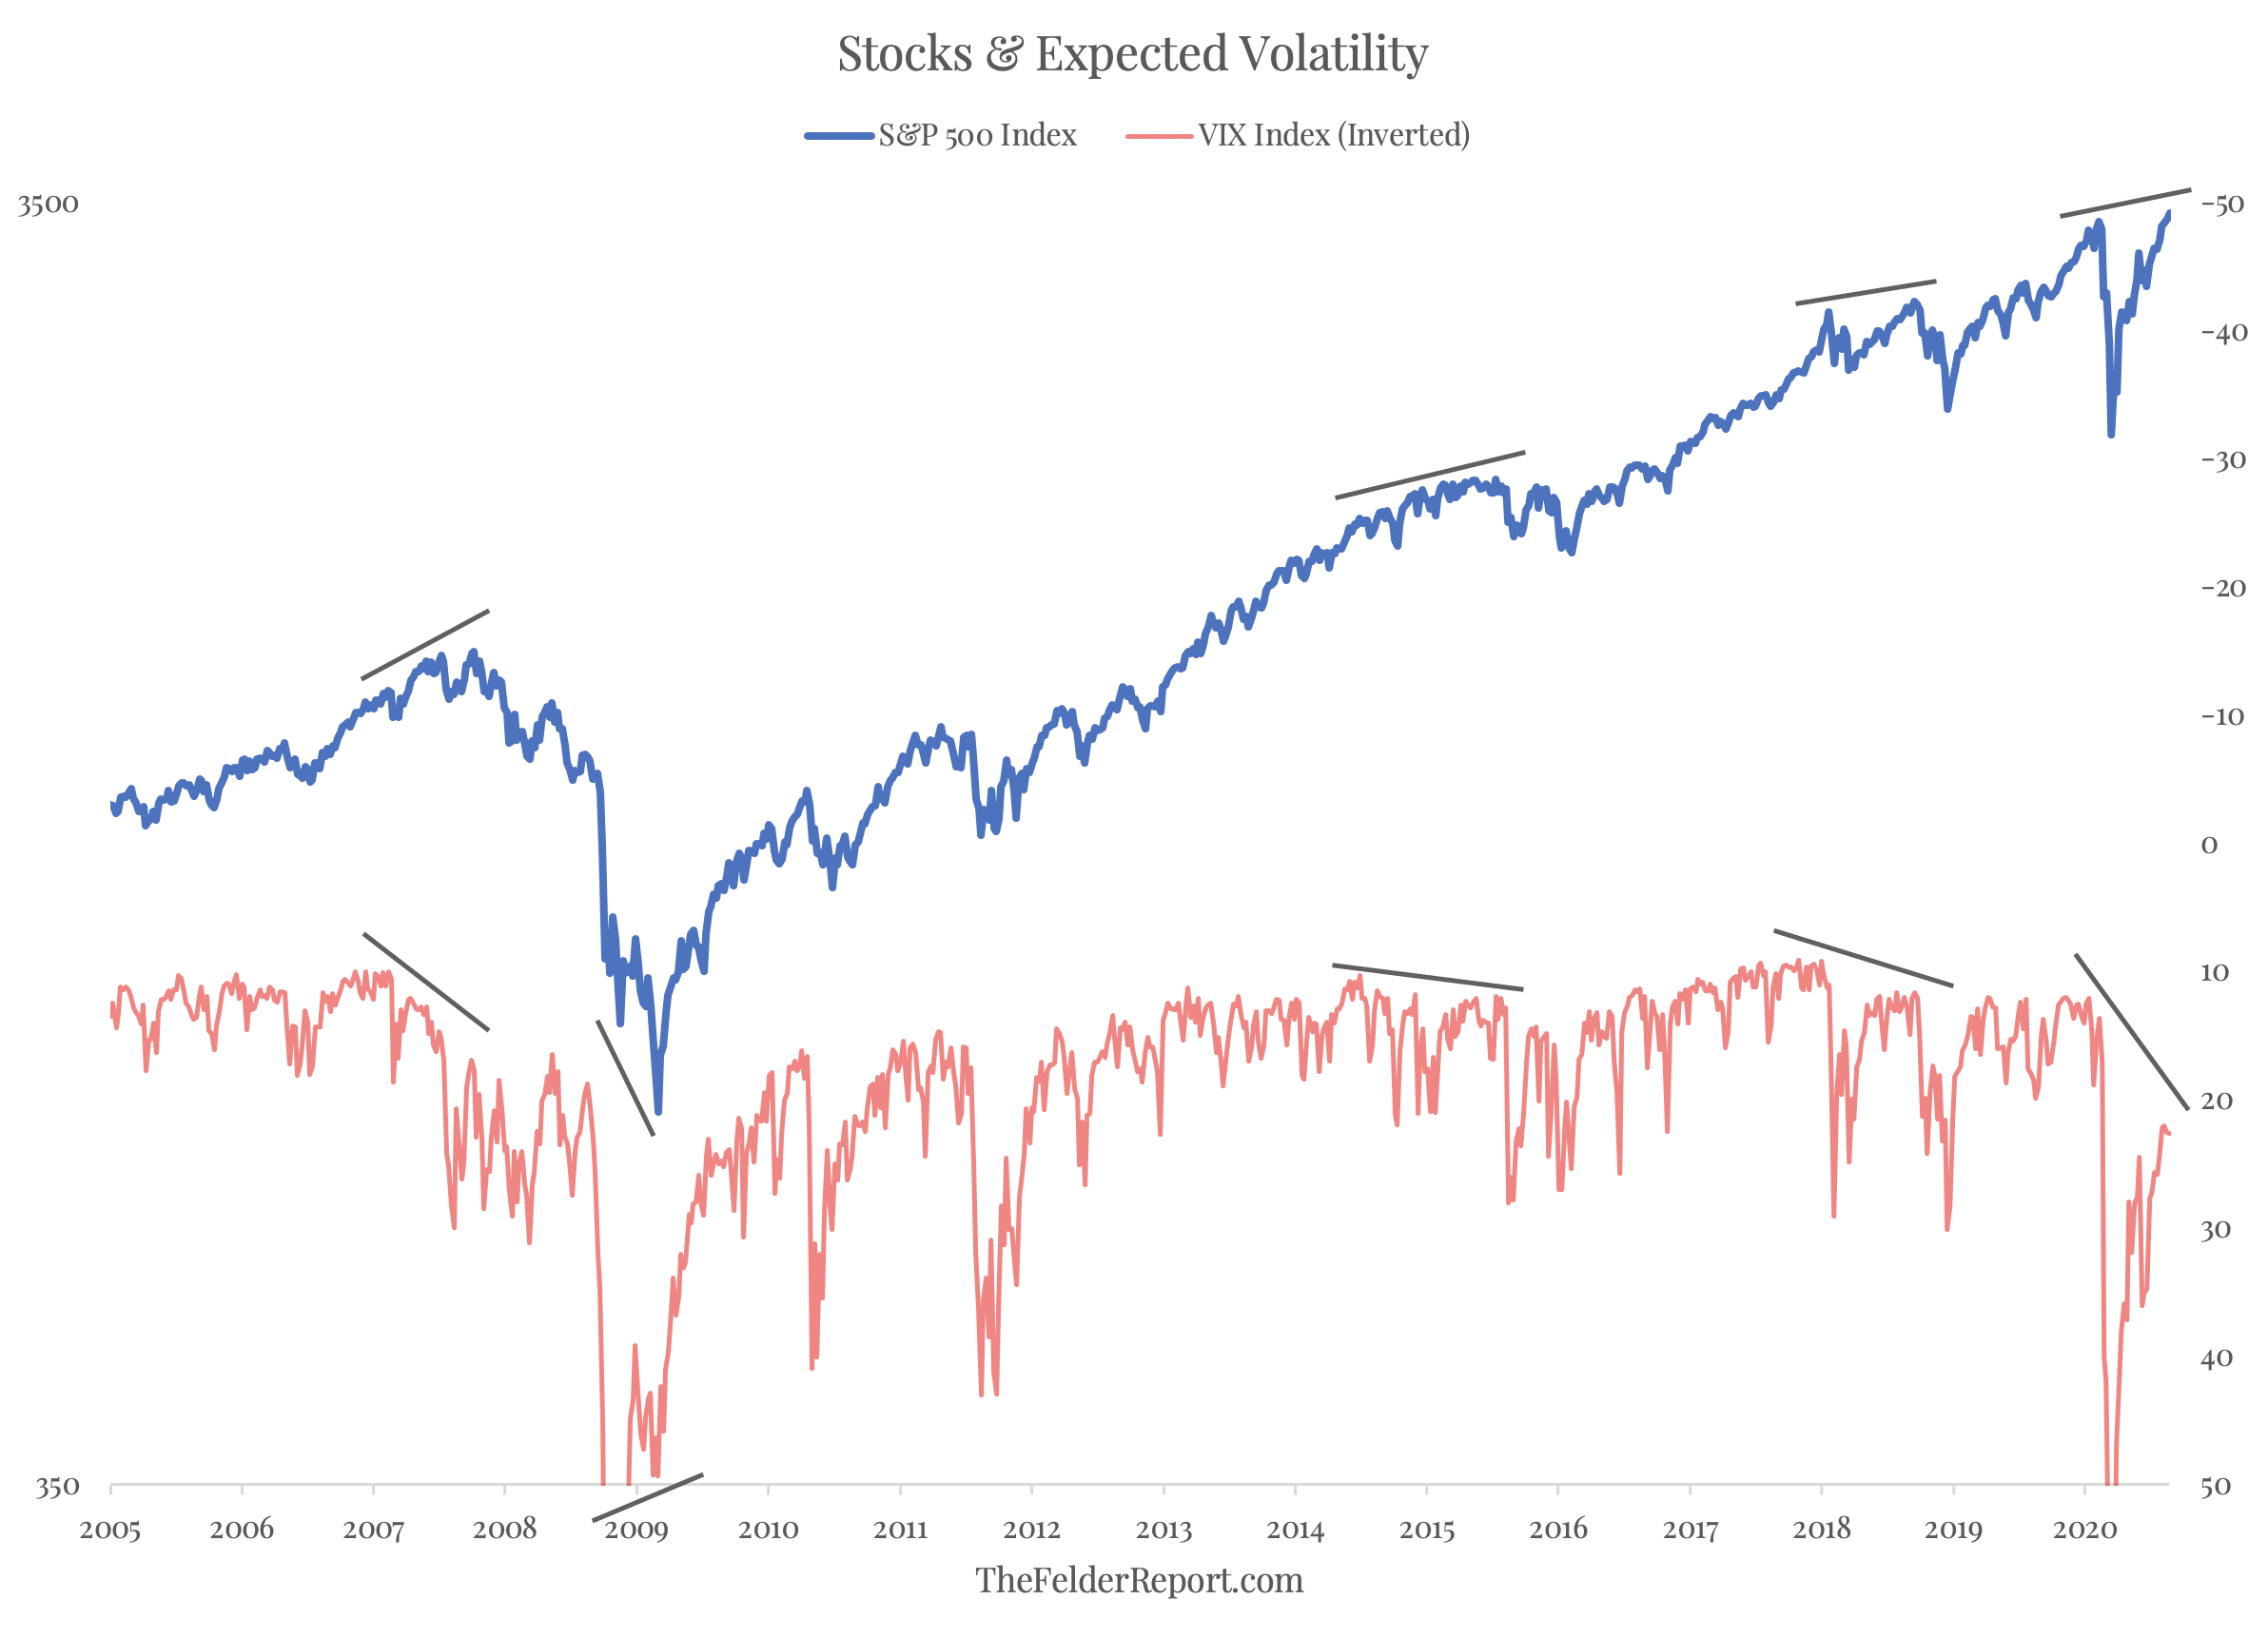
One of the indicators I like to watch in regards to the stock market is the relationship between it and expected volatility as indicated by the VIX Index. Typically, these should move in opposite directions: When stocks rise, volatility should fall and vice versa. When there is a divergence it can be a signal of an impending reversal.
For example, there have been several significant tops (and bottoms) identified by a divergence between the S&P 500 Index and the VIX Index. At the 2007 stock market top, the VIX showed a key non-confirmation that served as a red flag. Conversely, when stocks broke down to new lows in 2009 the VIX never came close to matching its 2008 highs, a bullish non-confirmation. Since then we have had several bearish non-confirmations that warned of significant corrections. Today, we have another such bearish non-confirmation.
We can also dial down into a shorter-term view by looking at the 10-day correlation between the S&P 500 Index and the VIX Index. When it rises into positive territory, meaning that stocks and volatility are generally moving in the same direction, it can also serve as an effective short-term sell signal, though it does trigger early at times. Right now, this VIX warning signal is flashing again as it did earlier this year and prior to the corrections in the first and fourth quarter of 2018.
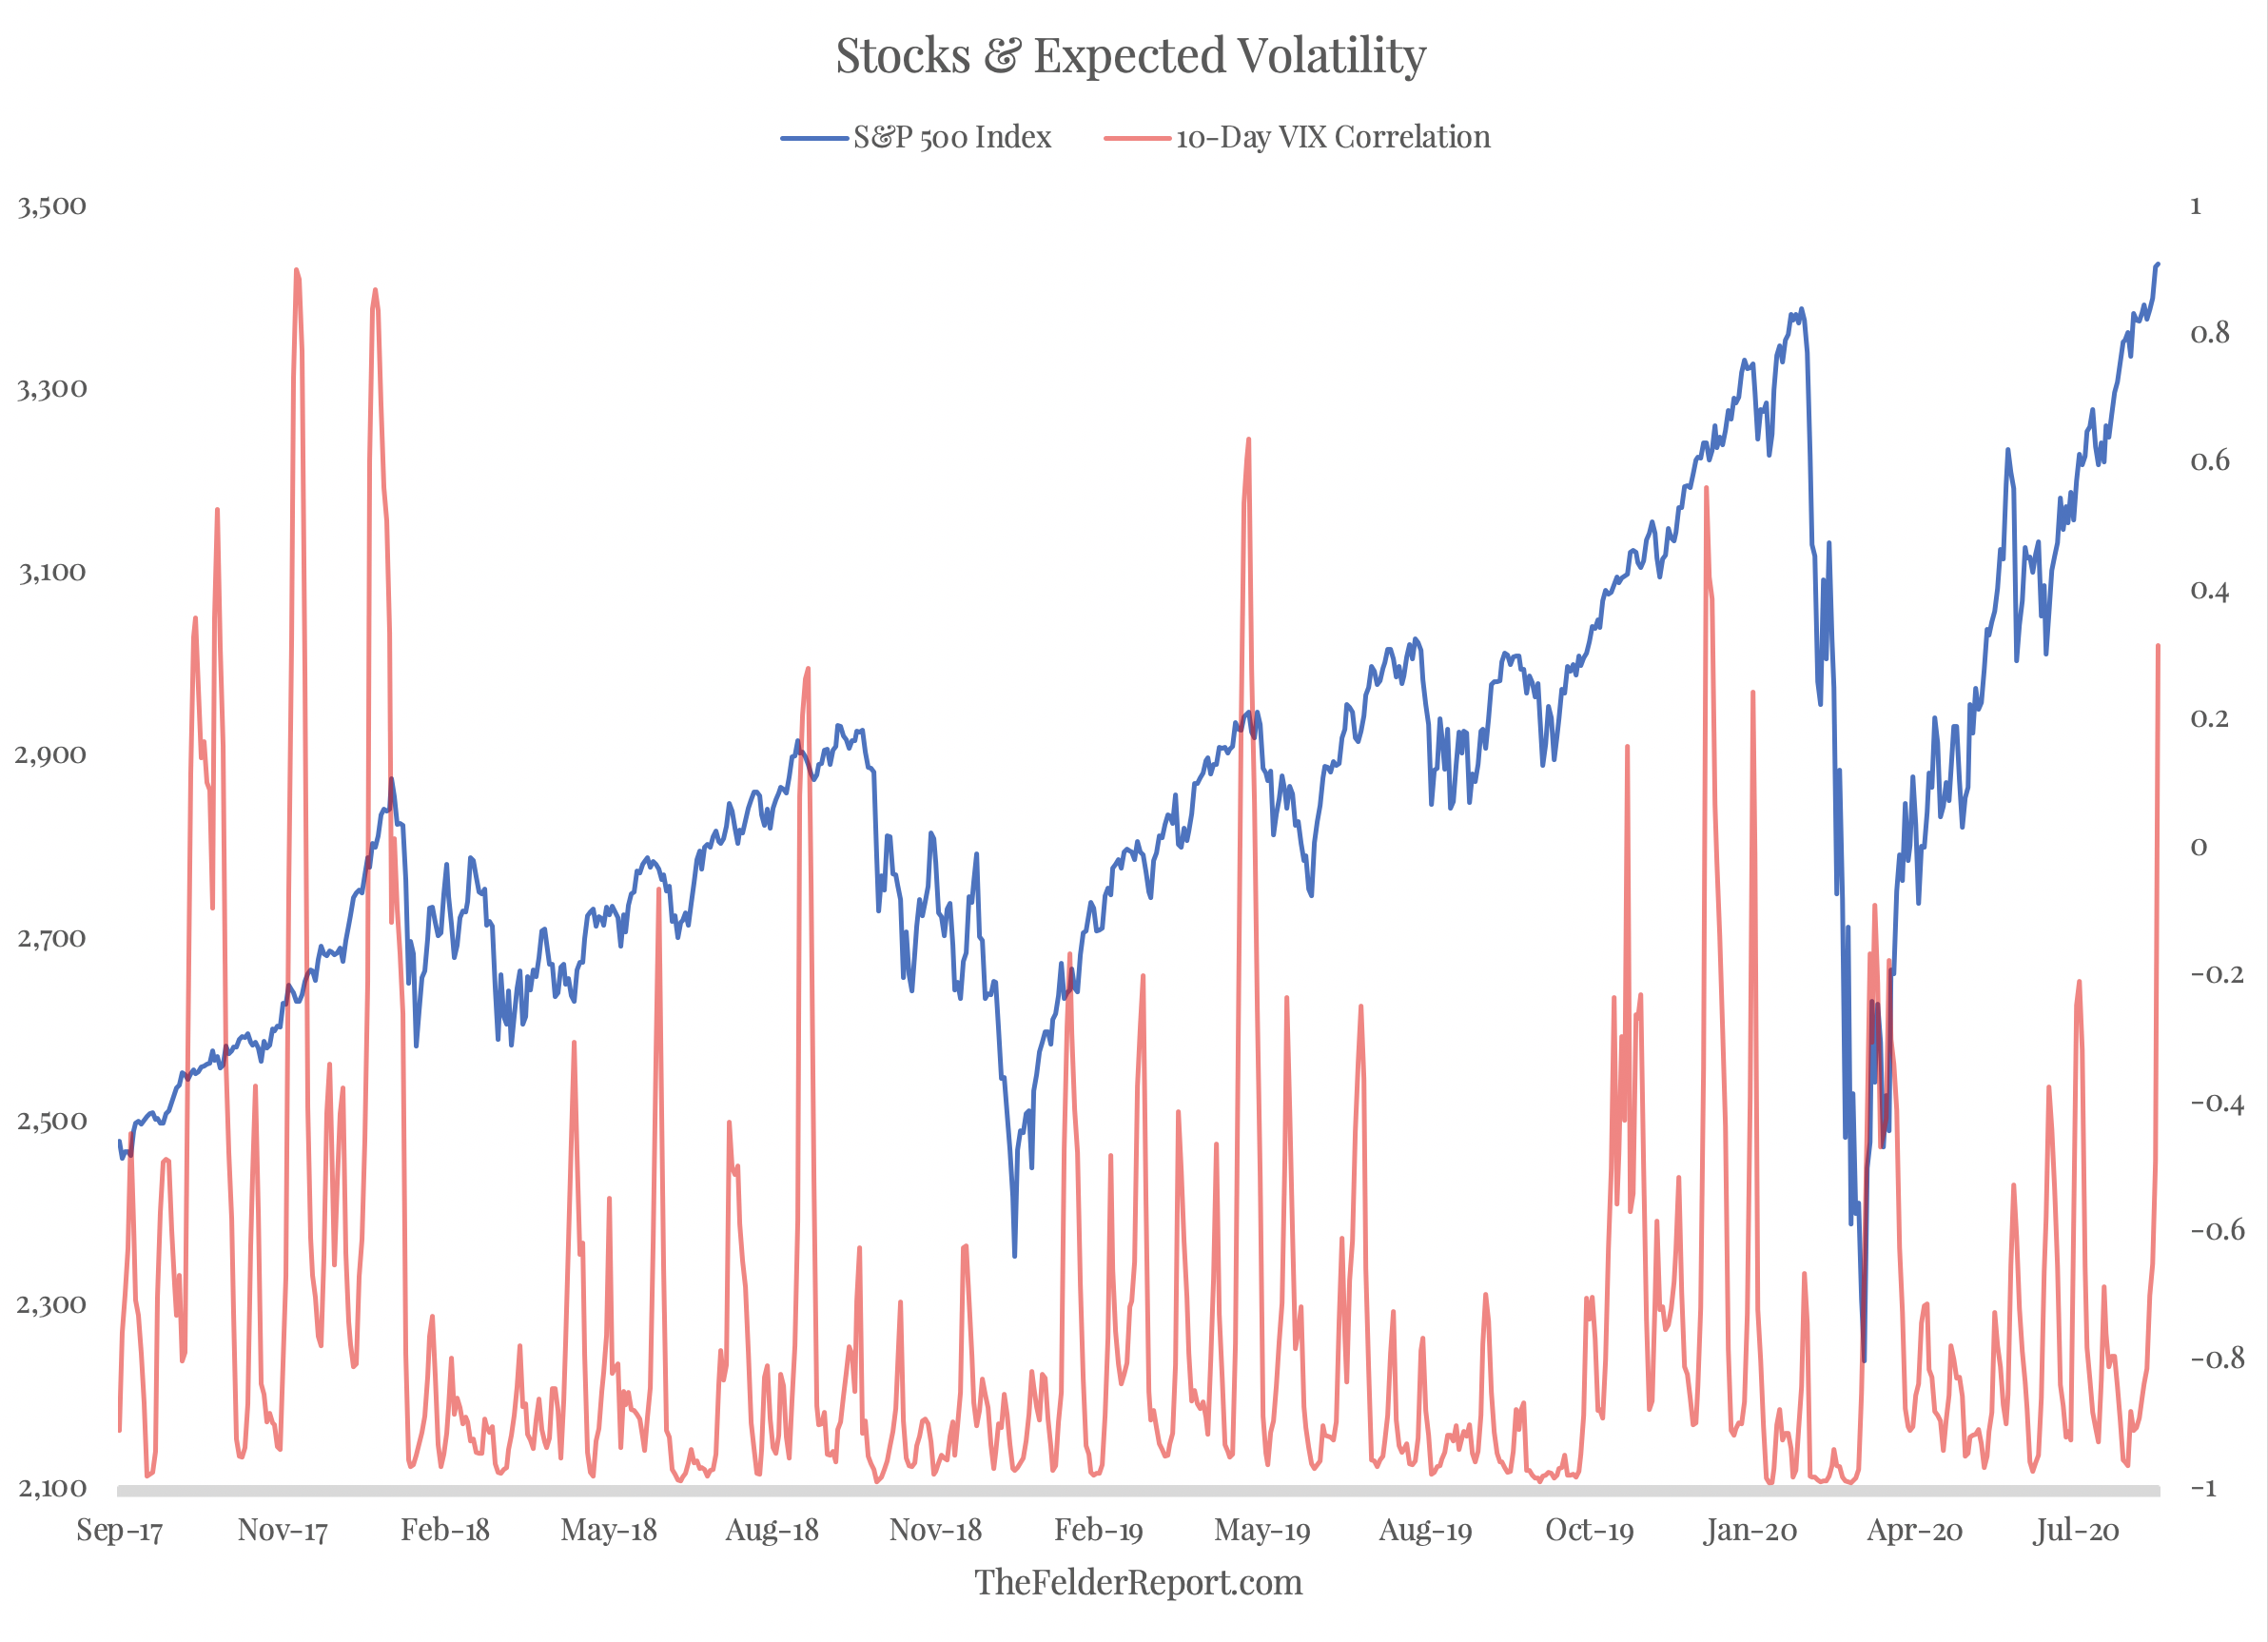
In short, the options market is sending a message that volatility going forward is likely to be greater than the stock market currently implies. And history shows the options market is usually the one who wins this sort of argument.