Regular readers know I like to try to combine fundamentals with technicals and sentiment to form a holistic investment/trading thesis. Right now I believe that these three factors are lined up on the bears’ side in the case of small cap stocks, which have led the broader indices of late – the proverbial tail wagging dog.
First, to say valuations are stretched in the case of small cap stocks doesn’t quite tell the whole story. In fact, they may have never been more stretched than they are today. (I’d love to see a CAPE ratio for the Russell 2000 if anyone’s got that data.)
The trailing price-to-earnings ratio currently looks fairly absurd:
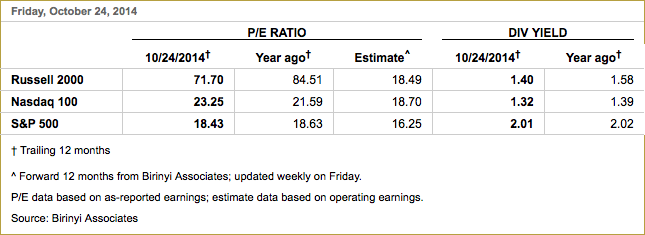
Chart via WSJ.com
I would assume that the astronomical level of the p/e is due to the fact that a large number of companies have losses rather than earnings. But even if you look at price-to-revenues the stocks look extremely overvalued. WSJ reports:
As of Sept. 30, for example, stocks in the Russell 2000 traded at 1.5 times their revenue of the previous 12 months, a measure known as the price/sales ratio. That is just a hair below the highest valuation seen going back to 1994, the earliest year for which data is available. Such levels were last seen during the stock bubble of the late 1990s, according to Russell Indexes.
The index would have to fall another 15% just to return to the average price/sales ratio of the past 20 years.
A price/sales ratio of 1.5 times in the Russell 2000 doesn’t happen often, says Lori Calvasina, a U.S. equity strategist at Credit Suisse Group CSGN.VX +0.08% who specializes in small and midcap stocks. “But whenever we’ve been there, the Russell 2000 has literally never been up 12 months later, and the average decline is about 16%,” she says.
So it’s hard to make the case that small caps aren’t currently overpriced and technically, they look vulnerable on a couple of time frames.
Back when the ETF broke out above the 82.5 level at the end of 2012 I called this chart the most bullish chart I could find. I’ve been watching ever since, adding the 1.618 Fibonacci extension which has proved to be significant resistance since early spring:

What’s most glaring about this chart is the recent selloff has seen the uptrend line that dates back to the 2009 low break. The ETF is now testing the underside of the trend line along with its 20-week moving average. So this correction is more than the typical brief pullbacks we’ve seen over the past two years.
Comparing it to the 2010 and 2011 corrections, then might give us a bit better idea of what to expect from this selloff. Notice both of those pullbacks saw the ETF make lower lows with divergences in RSI, volume and MACD histograms. Should the current selloff follow this pattern we should see a lower low made over the next few weeks.
The daily chart confirms this view. RSI (at the top of the chart) is showing another divergence/non-confirmation with the latest high made on Thursday. The index has failed to overcome its 61.8% retracement along with the other major indexes. Finally, volatility looks to have broken out and the pullback is just a test of the breakout level, suggesting we could see another surge in volatility soon. Unlike the other indexes, this relative high for the Russell comes in the context of a clear pattern of lower highs and lower lows, the definition of a downtrend:
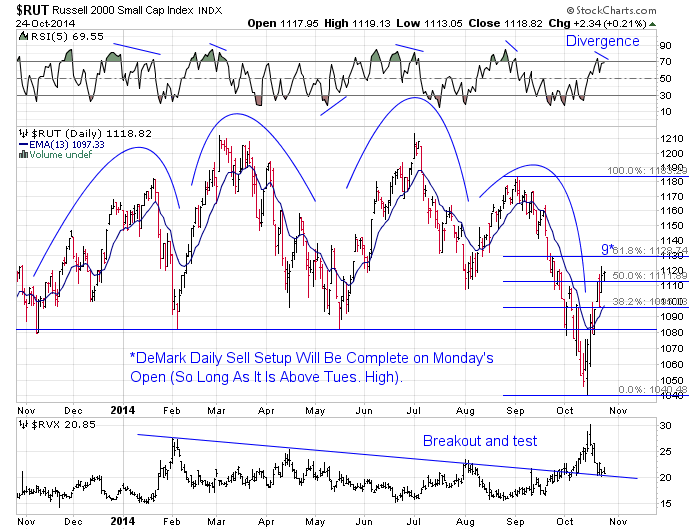
All of this makes a retest of last week’s lows very likely, in my opinion. It may be putting the cart before the horse, but I believe the big question after this next pullback will be whether this all amounts to a larger topping pattern for index.
Last month the index closed more than 1% below its 10-month moving average which amounts to a long-term sell signal for trend followers. Should it be unable to regain that level by at least 1% over the next few months, the most bullish time of year for the markets, I think it will be safe to assume the Russell will be faced with a new bear market lasting anywhere from roughly twelve to twenty-four months.
In fact, should the complex head and shoulders pattern in the chart above play out it would see the index decline to around the 950 area, a 21% decline which meets the definition of a bear market. But as I said, let’s see what happens over the next couple of weeks first.
Finally, sentiment toward the sector has surged. StockTwits traders are absolutely rip-snorting bullish on the Russell 2000 futures contract right now – even more bullish than they were a month ago when the major indexes were hitting all-time highs:
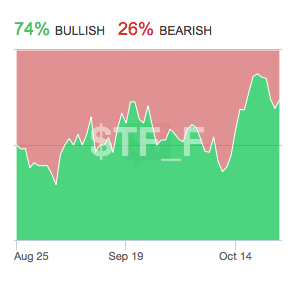
Chart via StockTwits
The bottom line is these stocks are overvalued, overbought and over-owned right now. What’s more, they have led the broader indexes over the past couple of months and I believe they could very well represent a significant “canary in the coal mine” investors should pay close attention to.
See also: “The Dominant Risk For Wall Street” May Be Manifesting In Small Caps and What Does “Reduce Risk” Mean To You?
Disclosure: I currently own inverse Russell 2000 ETFs (what amount to short positions) for myself and for clients.