There are two charts I’ve been watching for weeks now that I thought I would share today. Both represent critical Fibonacci levels in important indexes. For that reason they matter greatly to the broader stock market.
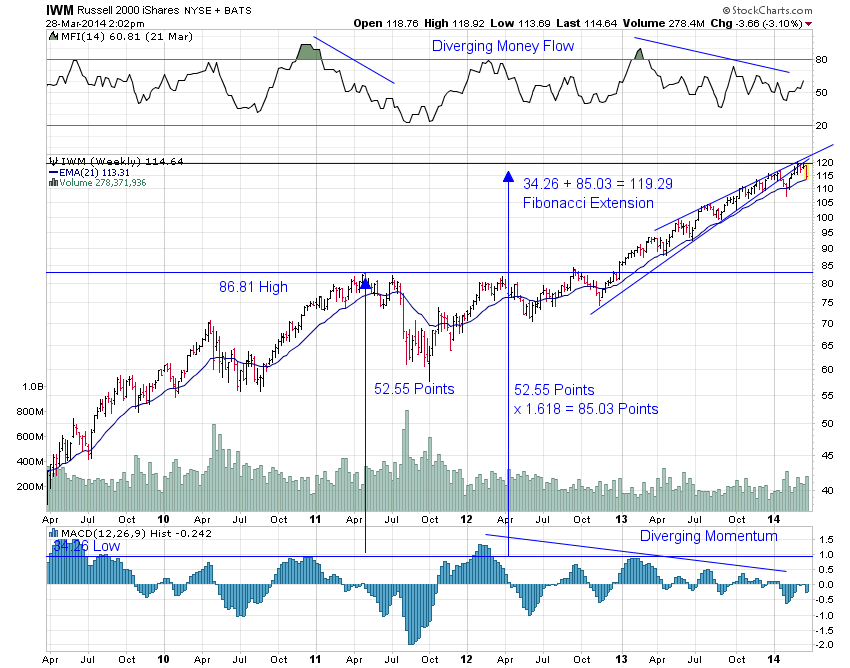
First is the Russell 2000 which represents small cap stocks. These little guys have just torn it up over the past few years – so much so that they are now trading at a valuation that is 26% above their late 90’s peak! A while back I labeled the breakout above $85 “the most bullish chart I’m watching right now.” Since then the index has soared nearly 40%. But now it’s running into the 1.618 Fibonacci extension within the context of a broken rising wedge (bearish) and diverging money flow and MACD (bearish):
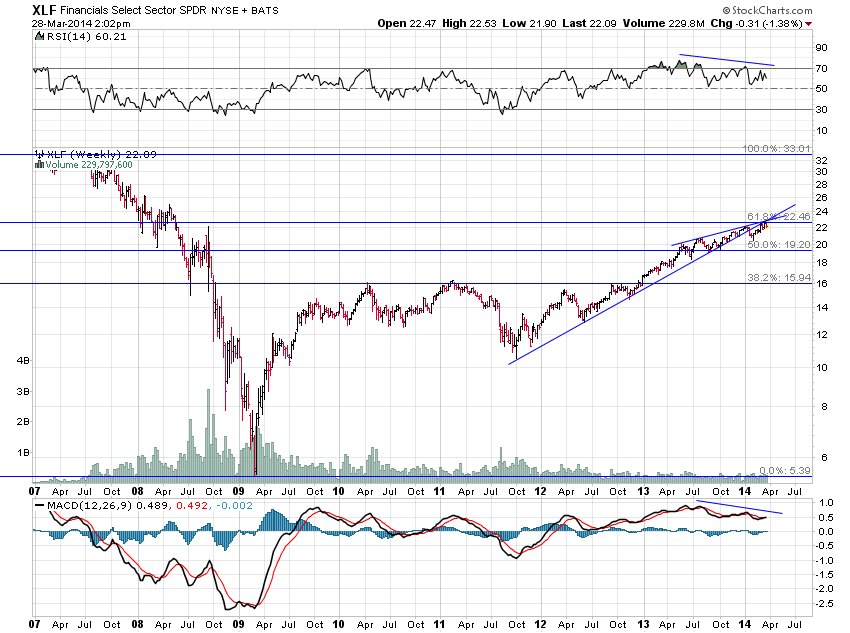
This next chart shows the weekly performance of the Financial Sector ETF. It hasn’t performed nearly as well as the small caps over the past few years as it still has a long way to go to recover the losses it suffered during the financial crisis. it’s now running into the 61.8% Fibonacci retracement of that decline also within the context of a broken rising wedge (bearish) and divergences in RSI and MACD (bearish).
Small caps have led the broader rally over the past few years and finance now makes up a very large part of our economy so both of these charts are key “tells” in my book.
For more fun with Fibonacci see “Nature by Numbers.”