Tom DeMark has been absolutely lambasted since he first proposed his 1929 analog a few months ago. It suggests stocks might be following a similar pattern today as they did back then, ultimately headed for a crash. Even many market watchers I deeply respect have turned the study into a joke on social media.
To these folks I’d just like to point them in the direction of Paul Tudor Jones II, one of the most successful hedge fund managers in history. Anyone who has read the original “Market Wizards” should be familiar with his story. It begins, “October 1987 was a devastating month for most investors as the world stock markets witnessed a collapse that rivaled 1929. That same month, the Tudor Futures Fund, managed by Paul Tudor Jones, registered an incredible 62 percent return.”
How did he do it? How did he manage to profit so handily from an event nobody saw coming? Jones answers, “our analog model to 1929 had the collapse perfectly nailed. [Paul Jones’ analog model, developed by his research director, Peter Borish, super-imposed the 1980s market over the 1920s market. The two markets demonstrated a remarkable degree of correlation. This model was a key tool in Jones’ stock index trading during 1987.]” The 1929 analog was the “key” that helped him predict and prepare for the crash.
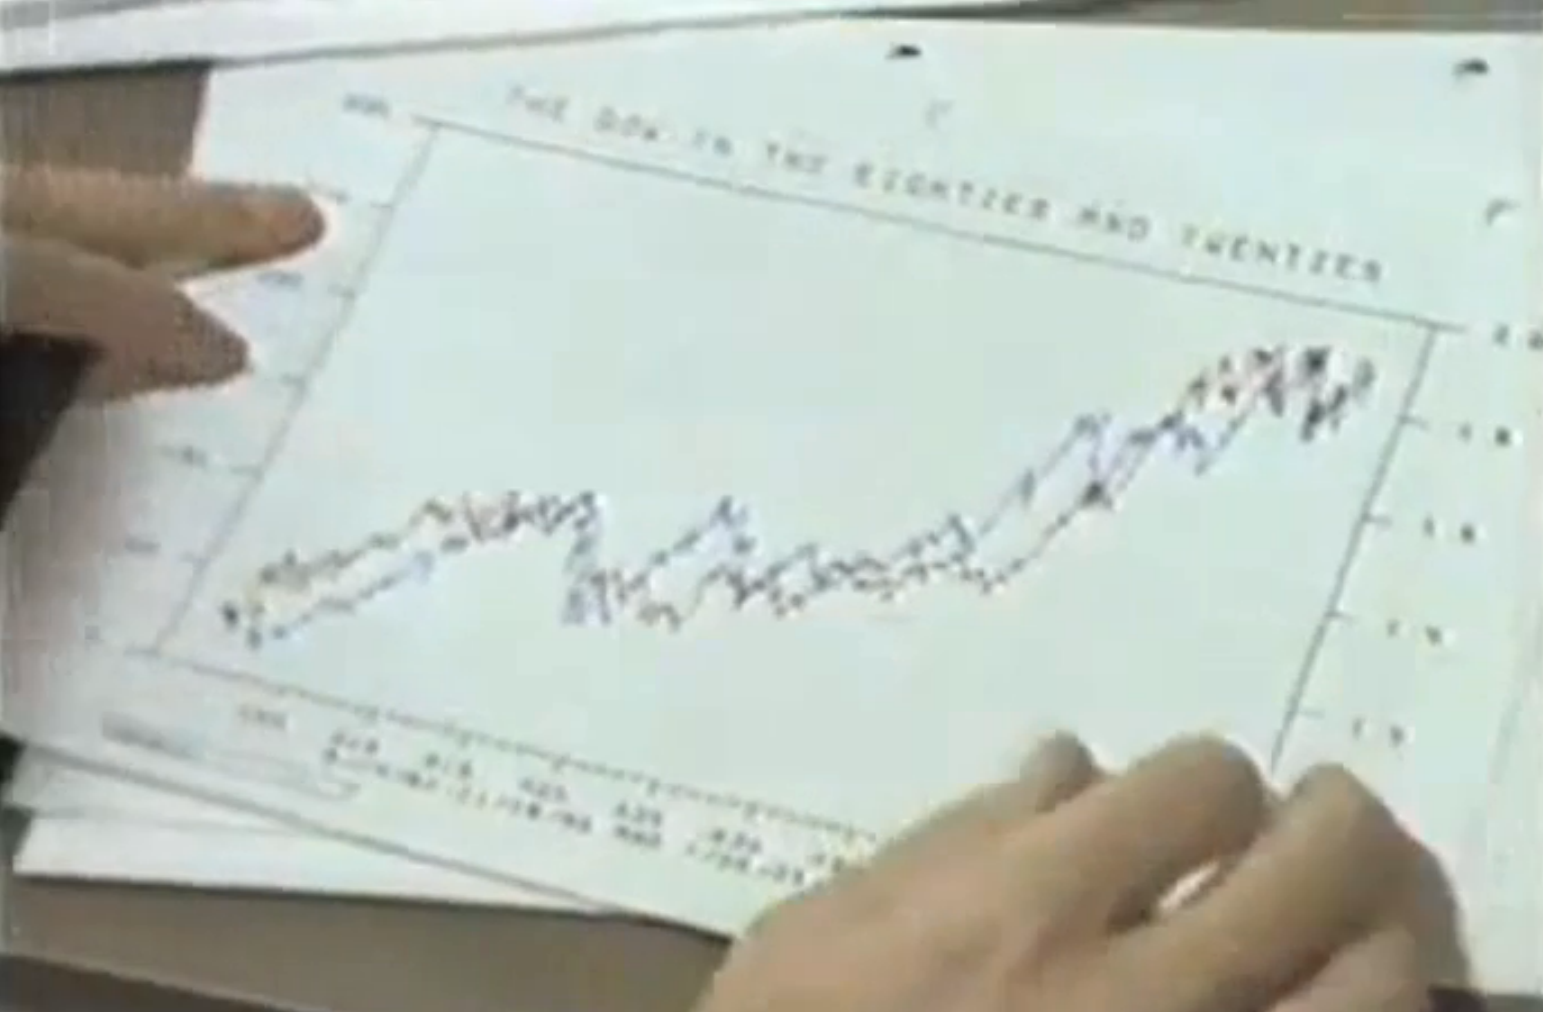 Photo via “Trader” (chart title reads “The Dow in the Eighties and Twenties”)
Jones and DeMark are two of the men I respect most in this business. I believe that one of the main reasons behind their success is their ability to, ‘keep their heads and have faith in their own convictions when all about them are losing theirs and doubting them.’ To me, this latest 1929 analog is still valid until the Dow Industrials make a new high. Until then, I’ll take the ridicule as a contrarian sign that Tom is onto something.
UPDATE: After I shared this post with Tom via email he shared this response with me:
In regard to the 1929 comparison it was taken entirely out of context and was merely a talking point. It originated from an interview with a business week reporter in early October. At that time, she was asking about the market and I forecast it would likely bottom October 7 or 8—interview was October 7 i believe—and it would rally 12.6% and a likely market top would appear. She asked if it would be a major market top and I replied anecdotally among the charts we were following at the time was a comparison between 1929 and the current market and I sent the chart to her. It showed the rally from the August 1929 low to the September 3, 1929 peak was also 12.6%. She asked if I expected the same outcome and my one sentence response which she quoted in the article and appeared beneath the gold chart– “I’m (the analog) not afraid I’m going to be wrong,” DeMark says. “I’m just saying it’s something to consider.” See link http://www.businessweek.com/
articles/2013-10-14/hedge- fund-chart-guru-tom-demark- sees-dark-days-ahead
Subsequent to the article we received various congrats as the both DJIA and SPX rallied 12.6-12.7% into their respective december 31 and Janaury 14 highs. Then the market declined and unexpectedly we received interview requests from virtually around the world. The casual comparison between the two periods surprisingly had taken on a life of its own. Late Novenber and December tv interviews served to fuel the fire of this analog. Finally when I appeared on CNBC at the february bottom the topic of conversation, just as it had been throughout the decline and in interviews, was the comparison and I was very clear it was unlikely to occur and assigned 10% likelihood and this was also mentioned on Glenn Beck interview about the same time.Now you have the background of how a casual remark erupted into something more than intended. Agree with your assessment that DJIA has not yet cancelled the comparison. In fact the following report by Goldman Sachs seems to agree with you as they conducted their own research of comparable market periods and the one with the strongest correlation was actually identical to what we off-handedly referenced in an interview early last Ocotber—see below for Goldman update.
BY the way, the gold forecast made in same interview and numerous times on tv late last year forecasting December 31, 2013 as the low in advance and which has been very accurate has been given little or no notice whatsoever. Strange. Here’s an excerpt from the Goldman note:
Recently, Tom DeMark brought up 1929 as a possible analog for today’s market. In discussing sentiment, I also showed how the idea of that analog was mocked in the media. In light of the fact that the Dow Industrial did not make a new high in tandem with SPX, I feel it is appropriate to make my contribution to the discussion.
Using a historical software product, I asked for the historical best match for the last 2.5 year (~500 days) of action in the Dow. Combing the Dow’s entire history, the best match was 1929 (Chart 6). The charts match up right in October of that year. The program uses a term “correlation” to judge the quality of the match. The correlation for the match is 97.5%. I have been using this software since 1997, and a match of that quality over a period of 500 days is relatively rare.
Bottom Line: My opinion is that it might be a good idea to protect yourself from a further decline in SPX.
To put the 97.5% correlation into context, in the “Trader” documentary, Peter Borish says that the 1987 correlation with the 1929 chart was roughly 92%.